
Talk-to-Listen Ratio: Formula, Examples and Limits
Calculate sales-call talk-to-listen ratio correctly, handle silence and overlap, and use the metric as evidence for better coaching.
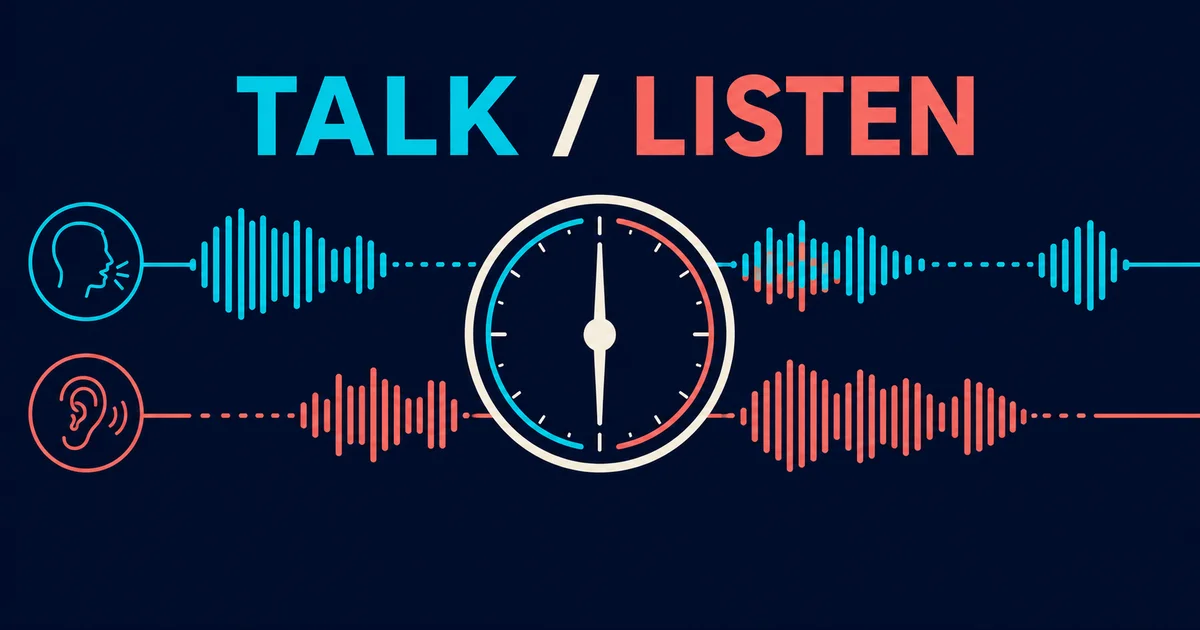
Talk-to-listen ratio compares the seller’s speaking time with the buyer’s speaking time during a call. Calculate it from speaker-attributed speech—not total call duration—then report silence and overlapping speech separately. The ratio can flag a seller-heavy conversation, but it cannot prove that the seller listened well, asked useful questions or advanced the deal. Use it as a diagnostic signal, not a performance verdict.
What is talk-to-listen ratio?
Talk-to-listen ratio is the proportion of attributed speech time produced by the seller compared with the attributed speech time produced by the buyer.
A 40:60 ratio means the seller produced 40% of the speech counted by the measurement policy and the buyer produced 60%. It does not mean the seller actively listened for exactly 60% of the call. The buyer’s speech may include digressions, hold interactions or responses that reveal little; the seller may be silent while reading, waiting or handling a system.
That definition exposes the metric’s central limitation: “listen” is usually calculated as other-speaker talk time. It is a convenient label, not proof of attention or comprehension.
How do you calculate talk-to-listen ratio?
Define these variables before calculating anything:
• S = seller speech duration, in seconds.
• B = buyer speech duration, in seconds.
• O = duration when seller and buyer speak simultaneously, in seconds.
• N = non-speech duration, including silence or hold time under your policy, in seconds.
• D = evaluated call duration, in seconds.
For the standard speech-time calculation:
Seller talk share (%) = S ÷ (S + B) × 100
Buyer talk share (%) = B ÷ (S + B) × 100
Talk-to-listen ratio = Seller talk share : Buyer talk share
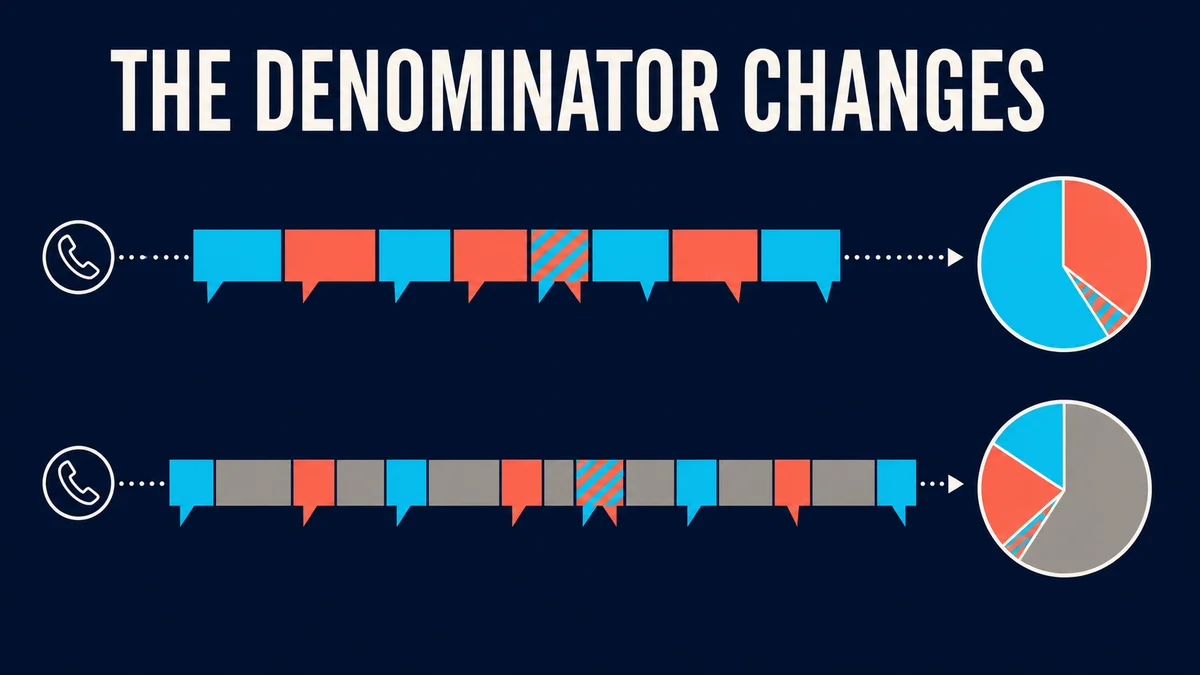
The two shares add to 100% only when both use the same speech-time denominator. If a dashboard divides each speaker’s time by total call duration, it is reporting wall-clock share, not the same metric.
Choose and disclose an overlap policy
Speaker diarization answers “who spoke when.” Open-source diarization tooling such as pyannote.audio represents speaker turns as time segments and supports speech activity, speaker change and overlapping-speech detection. pyannote.audio documentation.
Overlapping speech creates a counting decision because both speakers are active during the same clock time. Use one of these policies and name it in every report:
Policy | How S and B are calculated | What the ratio means |
|---|---|---|
Additive speaker activity | Count the overlap in both speakers’ durations. | Share of all detected speaker activity; S + B can exceed the union of speech time. |
Exclusive speech only | Remove overlap from both S and B; report O separately. | Share of non-overlapping attributed speech. |
Assigned overlap | Assign each overlap interval to one speaker using a documented rule. | An exclusive timeline, but the assignment can change the result. |
No policy is universally correct. Additive activity preserves that both people spoke; exclusive speech makes the denominator easier to reconcile with a timeline; assigned overlap can simplify downstream analysis but hides simultaneity. Consistency matters more than pretending these methods are interchangeable.
Keep silence outside the ratio
Silence rate (%) = N ÷ D × 100
Overlap rate (%) = O ÷ D × 100
Speech-activity detection can produce false alarms and missed detections. The pyannote.metrics documentation defines detection error rate as false-alarm duration plus missed-speech duration divided by total reference speech, and its evaluation options explicitly distinguish whether overlap is included. pyannote.metrics reference.
This matters because background noise misclassified as speech can inflate one speaker’s share, while missed short responses can make the other person appear less engaged.
Worked example: the same call, three views
Illustrative example—not a benchmark or customer result: a 30-minute sales call contains 11 minutes of seller-only speech, 14 minutes of buyer-only speech, 1 minute of overlap and 4 minutes of silence or hold time.
Component | Duration (minutes) | Share of 30-minute call |
|---|---|---|
Seller-only speech | 11 | 36.7% |
Buyer-only speech | 14 | 46.7% |
Overlap | 1 | 3.3% |
Silence or hold | 4 | 13.3% |
Using exclusive speech only, the denominator is 11 + 14 = 25 minutes:
Seller share = 11 ÷ 25 × 100 = 44%
Buyer share = 14 ÷ 25 × 100 = 56%
Talk-to-listen ratio = 44:56
Using additive speaker activity, each speaker receives the overlapping minute. Seller activity becomes 12 minutes and buyer activity becomes 15 minutes:
Seller share = 12 ÷ 27 × 100 = 44.4%
Buyer share = 15 ÷ 27 × 100 = 55.6%
The ratios look similar here, but that is an accident of the illustrative inputs. A call with more overlap—or overlap concentrated around one speaker’s turns—can move the result materially. Store S, B, O, N, D and the policy rather than saving only the final percentage.
Is 43:57 the ideal sales-call ratio?
No single ratio is an industry-wide rule. The frequently quoted 43:57 figure comes from Gong’s vendor research, not a universal standard.
Gong’s article published 20 March 2025 says its earlier analysis associated a 43% seller / 57% buyer split with top-performing conversations. The same article reports a newer analysis of 326,000 calls lasting at least 10 minutes: average seller talk time was 60%; closed-won calls averaged 57%; lost calls averaged 62%. Gong also says consistency, not merely the average, separated higher performers in that analysis. Gong’s 2025 talk-to-listen analysis.
Those numbers are useful context, but they do not establish causation or a target for every team. The dataset comes from one vendor’s environment, applies its eligibility and outcome definitions, and aggregates calls that may differ by market, role and stage.
Call type can reverse the practical expectation. Gong’s cold-calling analysis, published 16 August 2021, reports that sellers spoke 55% of the time in successful cold calls and explicitly warns that general listening advice does not transfer cleanly to cold outreach. Gong cold-call statistics.
Treat external figures as hypotheses to test against your own call types:
• Cold call: the seller may need to earn attention and explain the reason for calling.
• Discovery call: buyer speech can reveal needs, constraints and decision process.
• Demo: seller talk may rise while the product is being explained.
• Negotiation or renewal: the useful pattern may depend on issue ownership and stakeholder count.
• Support or complaint: long customer turns can signal complexity or frustration, not sales quality.
What talk-to-listen ratio does not measure
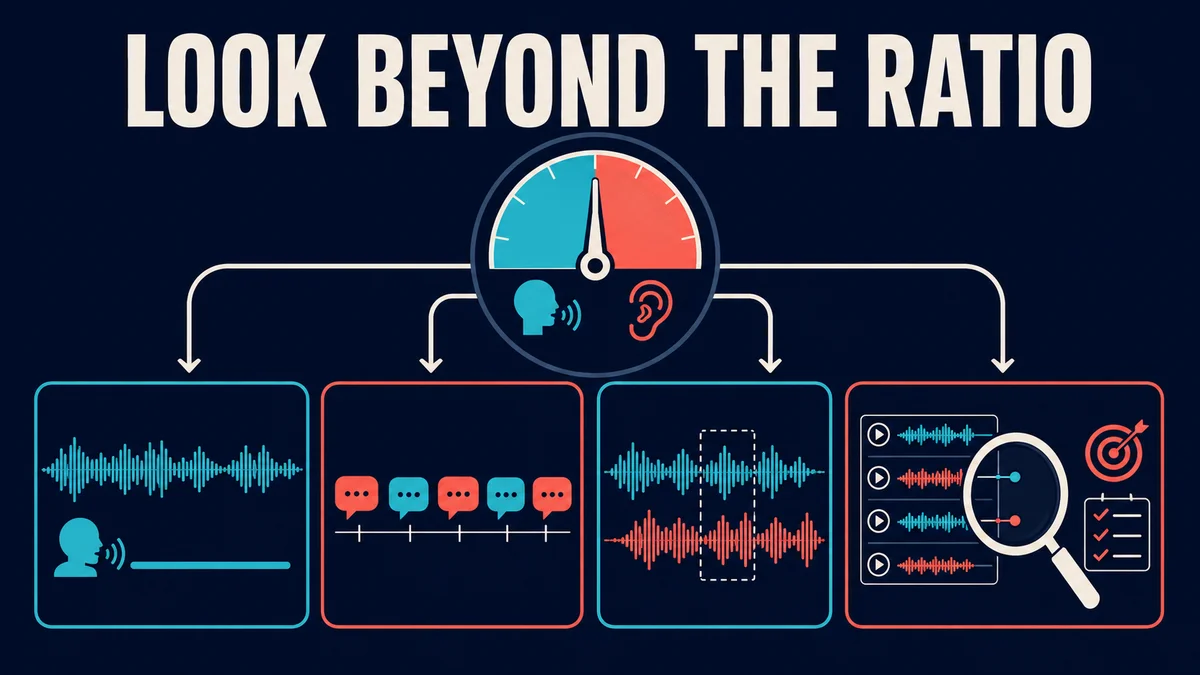
Two calls can both produce 45:55 and still be radically different. In one, the seller asks precise questions, follows the answers and summarizes accurately. In the other, the seller delivers several long monologues while the buyer speaks once at length.
Interpret the ratio with at least these supporting measures:
Supporting measure | Exact definition | What it can reveal |
|---|---|---|
Longest seller monologue | Longest uninterrupted seller-speech segment under the turn-boundary policy. | Whether the same talk share came from dialogue or a lecture. |
Turn count | Number of accepted seller-to-buyer and buyer-to-seller transitions. | How frequently the floor changed hands. |
Median turn duration | Median duration of attributed turns for each speaker, in seconds. | Whether participation was distributed or concentrated. |
Overlap rate | Overlapping speech duration ÷ evaluated duration × 100. | Possible interruption, backchannel or timing friction requiring review. |
Silence rate | Non-speech duration ÷ evaluated duration × 100. | Dead air, hold time or thoughtful pauses—context determines meaning. |
Evidence-linked questions | Seller questions connected to the buyer response and timestamp. | Whether questions produced useful discovery evidence. |
Research on conversational turn-taking across languages finds that speakers generally minimize both gaps and overlap, while also showing cultural variation in timing. That is another reason not to label every overlap an interruption or every pause a failure without listening to the evidence. Stivers et al., 2009, cross-linguistic turn-taking study.
How to build a reliable calculator
A useful calculator should accept raw durations rather than only total call length and seller time.
Required inputs
• Seller-only speech seconds.
• Buyer-only speech seconds.
• Overlap seconds.
• Silence or excluded seconds.
• Evaluated call duration.
• Overlap policy: additive, exclusive or assigned.
Validation rules
• Every duration must be zero or greater.
• Seller-only + buyer-only + overlap + silence should reconcile with evaluated duration within a documented timing tolerance.
• The calculator must not silently treat overlap as both speech and wall-clock time.
• Calls with an unknown speaker, corrupted audio or material diarization uncertainty should return review required.
• The output must retain the raw components and calculation version.
Recommended outputs
• Seller and buyer speech-time shares.
• Simplified ratio and unrounded percentages.
• Seller and buyer wall-clock shares, clearly labelled as separate metrics.
• Overlap rate and silence rate.
• Longest monologue, turn count and median turn length when timestamps exist.
• Warning when duration components fail reconciliation.
How should managers use the metric for coaching?
Use ratio to choose calls for review, not to grade a rep automatically.
• Segment first. Compare discovery with discovery, cold calls with cold calls and demos with demos.
• Look for a repeated pattern across calls, not one unusual conversation.
• Open the call at the longest seller monologue, high-overlap interval or extended silence.
• Read what happened immediately before and after the segment.
• Coach an observable behaviour: shorten the opening, ask one question, reflect the answer or pause after the buyer responds.
• Review later calls for the same behaviour and the quality of buyer evidence—not merely movement toward a target percentage.
A scorecard can capture these behaviours without making talk share a universal pass/fail criterion. See the Sales Call Scorecard Template and the manual Sales Call Audit Guide.
For automated measurement, define eligibility, exception handling and human review before scaling. The AI Call Quality Assurance guide provides that workflow. For the difference between conversation-level analysis and operational call metrics, see Conversation Intelligence vs Call Analytics.
Common measurement mistakes
• Dividing seller speech by total call duration while calling the remainder “listening.”
• Ignoring overlap or letting two tools use different overlap policies.
• Treating hold music, IVR time or internal transfers as buyer listening.
• Comparing discovery, demo and cold-call ratios in one leaderboard.
• Using a team average that hides large rep-to-rep or call-to-call variation.
• Assuming correlation between ratio and outcome proves that changing the ratio will cause more sales.
• Coaching toward a number without opening the relevant call segments.
Frequently asked questions
What is a good talk-to-listen ratio for sales calls?
There is no universal good ratio. Use external research as a starting hypothesis, then establish ranges by call type, market and stage using your own reviewed calls and outcomes.
Should silence count as listening time?
No. Silence is non-speech, not buyer speech and not proof of seller attention. Report silence separately so thoughtful pauses, hold time and dead air can be reviewed in context.
How should overlapping speech be counted?
Choose additive activity, exclusive speech or assigned overlap, document the policy and use it consistently. Always report overlap rate separately because simultaneous speech can otherwise disappear inside the ratio.
Does a lower seller talk percentage mean better listening?
Not necessarily. The seller may be attentive, distracted or silent for operational reasons. Confirm listening through evidence such as relevant follow-up questions, accurate summaries and responses tied to what the buyer said.
Can talk-to-listen ratio predict whether a deal will close?
It can correlate with outcomes in a particular dataset, but the ratio alone cannot establish causation or reliably predict one deal. Call type, qualification, offer, buyer role and many other variables influence the result.
Should talk-to-listen ratio be part of a sales scorecard?
It can be a diagnostic field or coaching trigger. Avoid universal pass/fail thresholds unless your team has validated them for the same call type and measurement policy.
How often should managers review the ratio?
Review trends at a cadence that matches call volume, and investigate material shifts after campaign, script, team, telephony or diarization changes. Always sample the underlying audio before acting.
Use the ratio to find the conversation
Talk-to-listen ratio is most valuable when it leads a manager back to a specific moment: a long monologue, a missed answer, a useful pause or an overlap that needs context. Define the denominator, preserve the components and coach the behaviour behind the number.
Planning a call-coaching measurement framework? Talk to CallOptix about the criteria, evidence and review decisions your team needs.
Related Articles

Get the Latest Insights
Get the latest insights on call center optimization and AI-powered sales strategies delivered to your inbox.
By subscribing you agree to receive marketing emails. Unsubscribe anytime.